I think we can all agree that the social media landscape is like shifting sand and constantly changing. More and more people around the world are using social media each year, and are using it in different ways. For this reason, I scoured the Net for the top social media statistics that will impact marketers and business owners in 2019.
This post and BONUS infographic will help you figure out exactly HOW and WHERE you need to Invest Your Resources in 2019!
Here is HOW and WHERE You Need To Invest Your Resources In 2019!
1. Over Half of the World’s Population is Now Online.
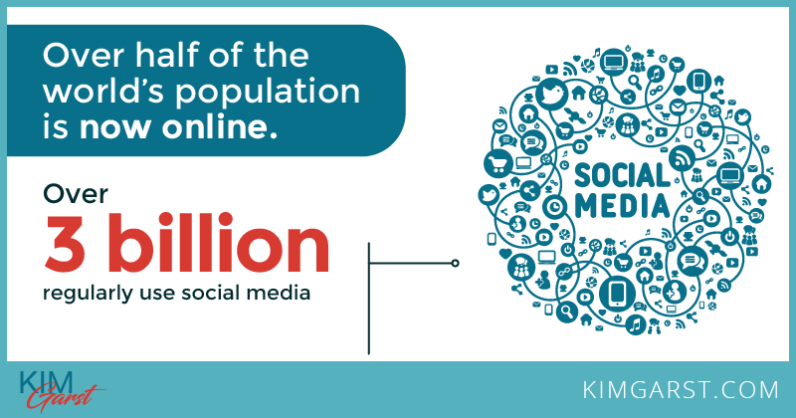
Over 4 billion people around the globe are now using the internet. And of these users, over 3 billion regularly use social media. According to We Are Social, this growth is largely attributable to the dramatic rise in mobile phone ownership. With 2/3 of the world’s population now having a mobile phone – that’s over 5 billion people – it’s no surprise how rapidly internet and social media use has risen.
Source: We Are Social (January 2018)
2. The Average Online Adult Spends 2 Hours 18 Mins Per Day on Social Media.
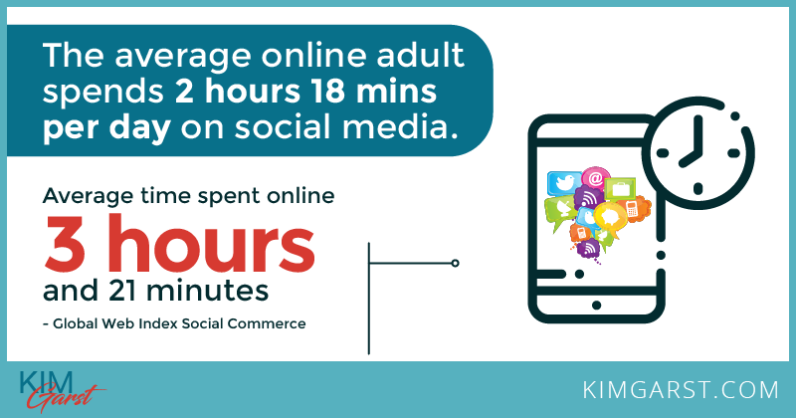
Daily time spent on social media continues to rise, albeit at a slower rate than in previous years. Time spent online also continues to increase, with the average time spent online now being 3 hours and 21 minutes per day. According to the Global Web Index Social Commerce in 2019 report, this increased time online and on social media underscores the need for businesses to be visible online – “more frequently, but in a less prolonged manner”.
[click_to_tweet tweet=”According to the Global Web Index Social Commerce in 2019 report, this increased time online and on social media underscores the need for businesses to be visible online – “more frequently, but in a less prolonged manner”.” quote=”According to the Global Web Index Social Commerce in 2019 report, this increased time online and on social media underscores the need for businesses to be visible online – “more frequently, but in a less prolonged manner”.” theme=”style6″]
Source: Global Web Index (2019)
3. YouTube is the 2nd Most Viewed Website on the Net.
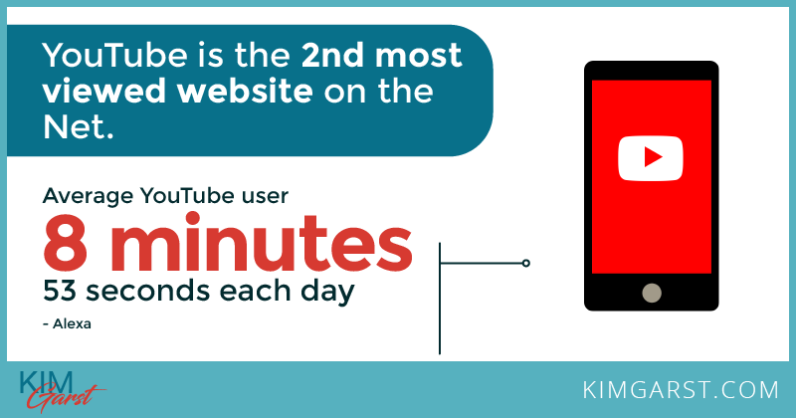
This puts YouTube second only to Google in terms of views. The average YouTube user is on the platform for an average of 8 minutes 53 seconds each day, viewing an average of 5 pages per visit. Facebook follows YouTube as the third most viewed site, with the average person using the platform for slightly longer – 9 minutes 30 seconds – but only viewing an average of 4 pages per visit.
[click_to_tweet tweet=”The average YouTube user is on the platform for an average of 8 minutes 53 seconds each day, viewing an average of 5 pages per visit” quote=”The average YouTube user is on the platform for an average of 8 minutes 53 seconds each day, viewing an average of 5 pages per visit” theme=”style6″]
Source: Alexa (as of March 19, 2019)
4. Instagram was Part of 93% of All Influencer Campaigns in 2018.
This makes Instagram the #1 choice for marketers wanting to use Influencer marketing. Some of the most popular Instagram features for influencer campaigns include Stories and the new Countdown Sticker. According to Global Web Index, this opens up important new opportunities for business owners to skip the middleman and connect directly with consumers through Instagram.
Source: CreatorIQ and Global Web Index (2019)
5. 55% of Internet Users are Social Shoppers.
Social shoppers are more than just those who use a “buy now” button on social media. According to a survey by Global Web Index, 55% of respondents said they have used social media to research or find products to buy. The survey also found that social shopping is even popular among the younger demographic, with 60% of 16-34 year-olds using social media to find and buy products and services.
Source: Global Web Index (2019)
6. Snapchat is the #1 Social Platform Among Teens.
A survey done among teens who use Snapchat showed that 47% said Snapchat was their favorite social media platform. This was followed by Instagram at 24%, Facebook at 9%, and Twitter at 7%. Pinterest came in last, with just 1% of teens saying it was their favorite platform.
Source: Piper Jaffray (Fall 2017)
7. In Terms of the Number of Active Users, Facebook is Still #1.
Based on the social media statistics research out there, Facebook now has 2.32 billion monthly active users. Of these, 1.52 billion people check in to Facebook daily. If we count all of Facebook’s core products – Facebook, Instagram, Messenger, and WhatsApp – the number of monthly active users jumps to 2.7 billion.
[click_to_tweet tweet=”Facebook now has 2.32 billion monthly active users. Of these, 1.52 billion people check in to Facebook daily.” quote=”Facebook now has 2.32 billion monthly active users. Of these, 1.52 billion people check in to Facebook daily.” theme=”style6″]
Source: Statista (4th Quarter 2018)
8. Mobile Users Spend More Time on Social Media Than on Any Other Type of App.
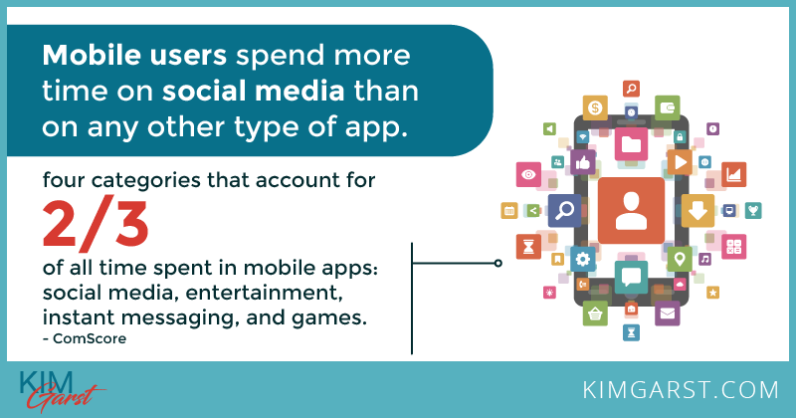
While mobile users in Canada and the US spend the most time on entertainment apps, the average user worldwide spends more time on social media than on any other type of app. According to ComScore, despite the growing number of apps users could choose from, there are still four categories that account for 2/3 of all time spent in mobile apps: social media, entertainment, instant messaging, and games.
Source: ComScore (Mar 2018)
9. WhatsApp Continues to Rank #1 Among Messaging Apps.
![]()
According to a ComScore report, WhatsApp is the leading instant messaging app globally. However, this same report found that in the US, Canada, France, and the UK, Facebook Messenger remains the IM app of choice.
Source: ComScore (2018)
10. Video is the #1 Type of Content Consumers Want to See from Brands.
According to Hubspot, more than half (54%) of consumers want to see video content from their favorite businesses. In comparison, 46% are interested in emails and newsletters, 41% want to see social images, and a mere 18% want to read blog posts. And according to Promo.com, the popularity of video could be even higher: according to their recent survey, 74% of respondents said they prefer to learn about a product via video (as compared to just 26% who prefer to learn about it through a blog post or photo). Want to start incorporating videos into your marketing strategy for 2020, but aren’t sure where to start? Check out my post, The #1 Video Tool You Should Be Using in Your Business.

4 thoughts on “Top 10 Social Media Statistics for 2019”
great work as usual with your usual flair and style
Snapchat and Instagram are the “thing” now for the teens/millennials. Anyway, thanks for sharing!
Thanks Kim for sharing Top 10 social media statistics.
Hello there,
This is an amazing post. I read your post. The ordinary man will benefit a lot from your post. I also benefited from your post. You have said about ten social media on how to earn from here are notable among Youtube, Instagram, Facebook, Snapchat, Whatsapp, etc.